Voronoms: an approximate set of admin area polygons for and from the GeoNames gazetteer
I just uploaded v1.0.0 of Voronoms, a set of GeoJSON shapes for admin areas1 in the GeoNames dataset, and the Python code I wrote to generate them. Voronoms differs from other datasets of admin areas in that it’s generated entirely from the location data in GeoNames. As such, its outlines won’t be entirely accurate, but they’re free and available for all countries in the same dataset.
There’s more information in Voronoms’s README file. This post will give an overview of Voronoms, and go into a bit more detail about some parts of its approach.
From the README:
GeoNames is a free dataset of place names (a gazetteer). Each GeoNames entity represents a named location, and its metadata (described in more detail in GeoNames’s readme) include multiple alternate names, a single longitude and latitude point, plus its position in the administrative hierarchy of a country. For instance, Brooklyn is contained in Kings County, which is contained in New York, which is in the United States.
Because GeoNames has global coverage, it’s useful for working with data admin-level data (like cases of a disease) from more than one country. But if you want to make a choropleth map of data that’s linked to administrative areas, you’re out of luck, because GeoNames only has a single set of geographic coordinates for each place.
Your options are:
- Find a premium dataset of global admin outlines. GeoNames offers one such dataset, which uses officially-published polygons assembled from various sources.
- Assemble admin outlines from their original sources yourself.
These might be are cost- or time-prohibitive though. In those instance, Voronoms can provides a free, albeit lower-quality, alternative. Its outlines are available in the same GeoJSON format that GeoNames uses to provide country outlines, so it can easily be joined to the existing GeoNames dataset by GeoNameID.
How does Voronoms work?
Voronoms’s GeoJSON shapes are automatically generated from GeoNames’s data on admin areas and the places they contain. It uses a method similar to that described in Alani et al.’s 2001 paper “Voronoi-based region approximation for geographical information retrieval with gazetteers”.
The gist is that it draws a Voronoi diagram from the GeoNames points in a given country, then groups the cells of the Voronoi diagram by the admin regions of interest, and joins each group into sets of polygons. It uses some heuristics to clean messy data, and cuts out the outline of the country using GeoNames’s country outlines. The bulk of this happens in voronoms/process.py.
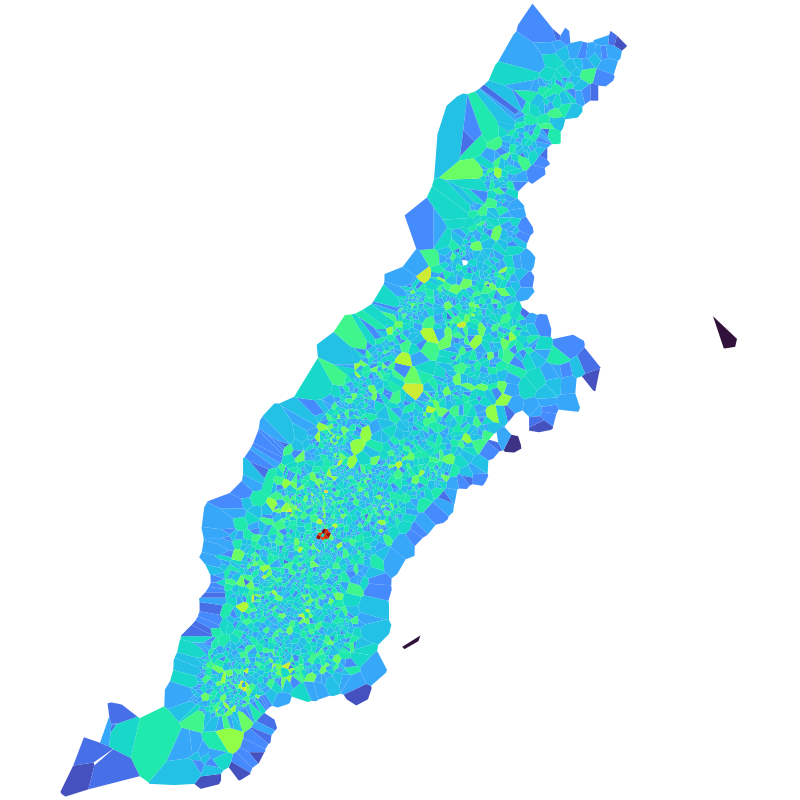
Looking at the Voronoi cells for a single admin area, such as Manhattan, might give you an idea of how Voronoms puts together its admin shapes.
The GeoNames hierarchy
This is possible because GeoNames has information on administrative hierarchies in countries. This comes in two forms:
- Administrative regions have a parent region. For instance, in the US, “admin level 1” corresponds to states; these are all listed as being contained in the United States. Admin level 2 is generally counties; these each have a state as their parent. GeoNames provides this data by itself in a file
hierarchy.zip, which is available from their data download page. - General containership data. Each GeoNames entity has fields for which administrative entity it’s contained in at five levels of administrative hierarchy. So a place in Manhattan might have the code for New York County as its
admin2 codeproperty, “NY” as itsadmin1 codeproperty, and “US” as itscountry code.
In the current version of Voronoms, we draw each level of the hierarchy separately, and don’t use any information about containership. This could potentially be used to improve the outlines for administrative levels with poor data — if you have a sparse admin3 level for a country, but good admin2 outlines, the admin2 boundaries could constrain the shapes of the admin3 outlines. However, there are a few instances where the hierarchy is weird (e.g. “New York City” is the “child” of five counties). I’m sure there are ways around this, but they aren’t for v1.0.
Data cleaning
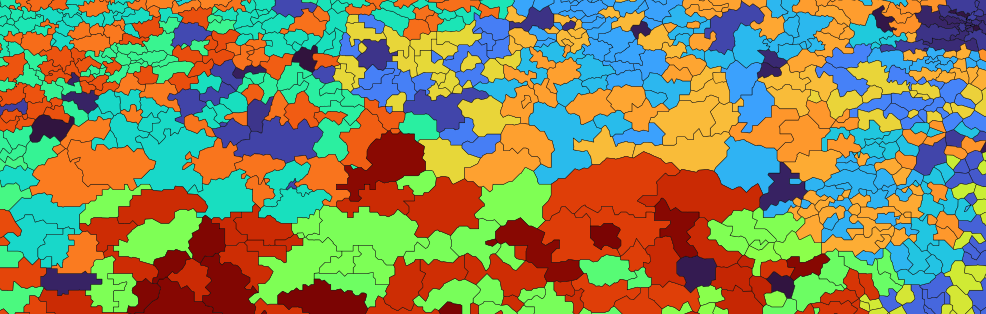
A smattering of GeoNames entities are mislabeled, either with the wrong region, or with slightly incorrect longitude and latitude coordinates. This means that there are a few points labeled as being in Manhattan but falling in New Jersey. When you extract the polygons from the Voronoi diagram and don’t do any cleaning of these points, you get something that looks like this:
This figure shows New York’s counties in the top of the state. You can see that there are a few Voronoi cells inside the green county which have been assigned to the Orange County to its left.2
My first attempt at solving this was super simple:
- Fill in each polygon
- Delete any polygon that’s contained by another polygon.
This works great in most cases, but falls down when you have an admin area that’s entirely contained inside another area.
A good example is the United Kingdom’s admin2 level, which, for example, contains both the county Leicestershire and the city of Leicester, a pattern which is repeated in a few neighboring counties.
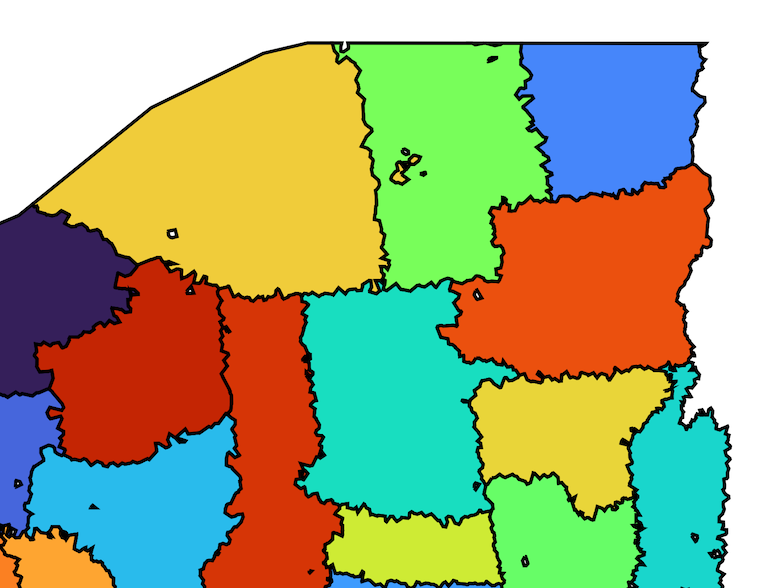
If you apply that simple data cleaning step to this region, it looks like this:
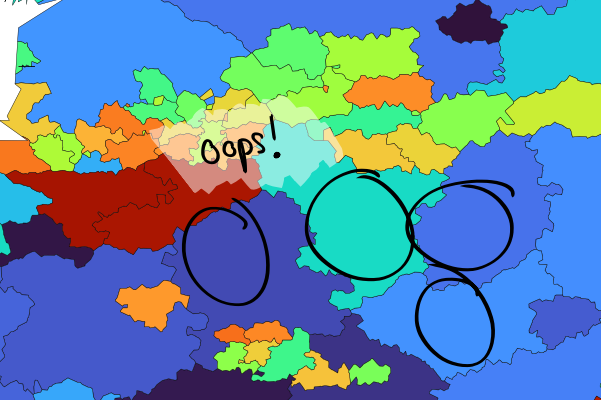
Most of the wrongly-assigned Voronoi cells are fixed (except a few that fall on boundaries, which I don’t know how to fix). But Leicester and a few other cities now have no polygon.
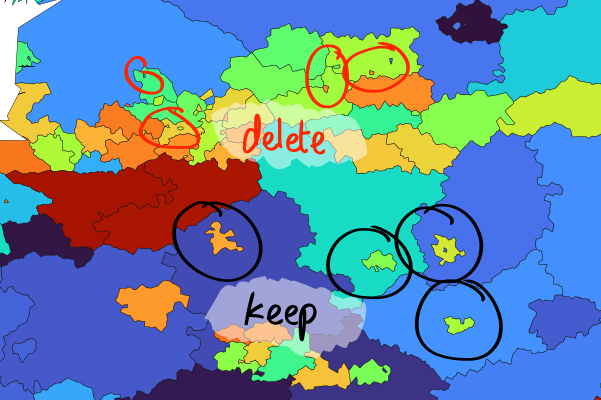
Voronoms uses a simple heuristic which marks certain polygons as un-deletable before applying the algorithm above, which gives you the best of both worlds:
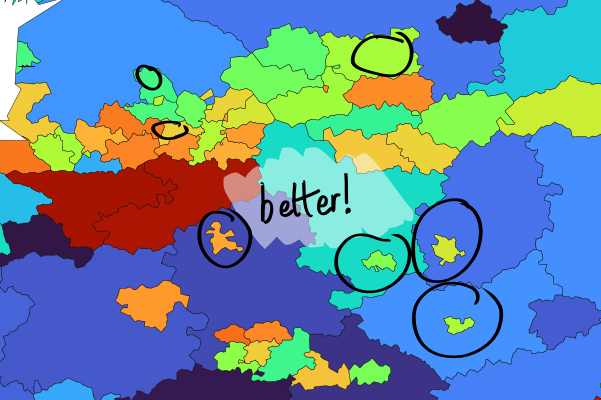
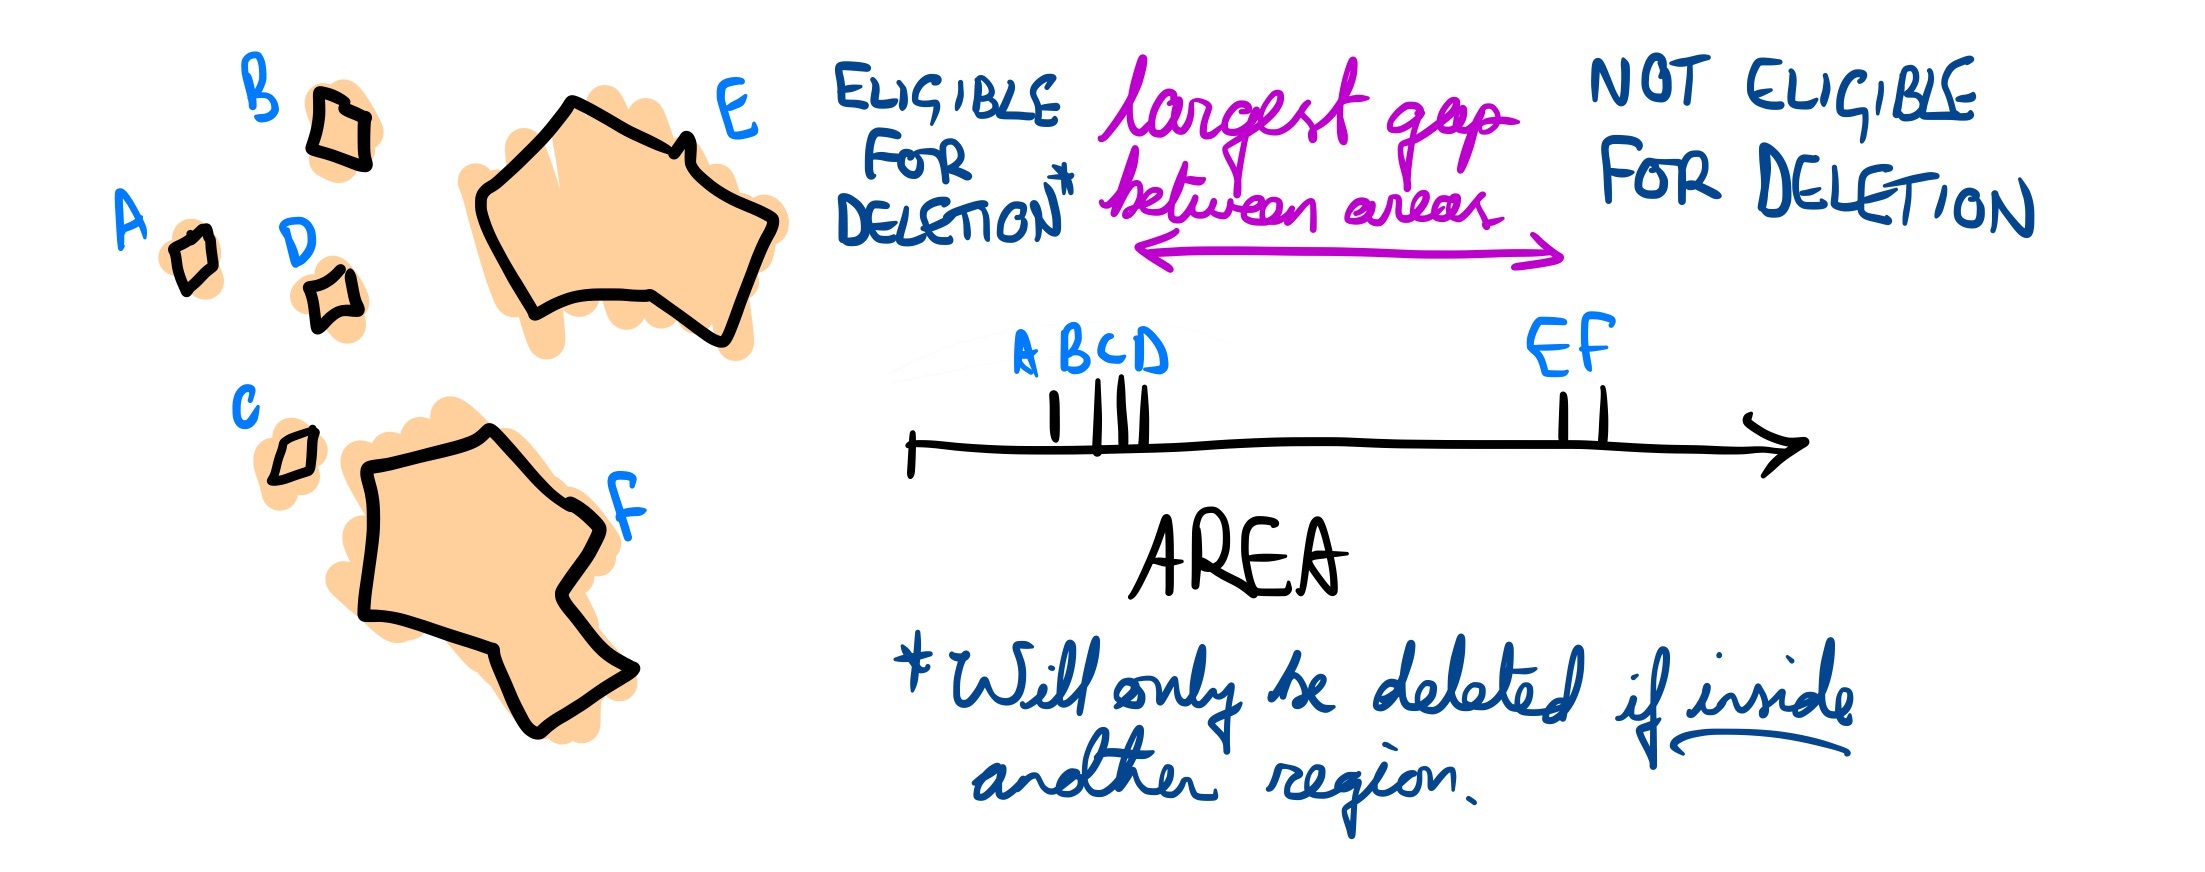
Voronoms will not delete a polygon, even if it’s contained by another region, if (1) it’s the only polygon for a region, or (2) it’s above the largest difference in size between the polygons for a region. That second criterion is a mouthful; let me do a better job of explaining it.
If a region is made up of six polygons, two of which are pretty big but four of which are tiny, the biggest gap will (hopefully) be between those regions’ areas will be between the tiny and the big regions. The smaller regions will be deleted if they fall within another polygon, but the bigger regions won’t.
How well does Voronoms work, and what does it look like?
Voronoms is available for admin levels 1–3 for all countries (see below for more details). The quality of the shapes produced for each country/level depends on the structure of the GeoNames data for that country. For instance, entries for a country don’t include data on containing admin2 areas, the shapes produced for admin2 regions will just look like a Voronoi diagram.
Here are some examples (click to view full-size).
Bangladesh’s admin levels 1–3 look pretty well-structured.
| BD-1 | BD-2 | BD-3 |
|---|---|---|
 | 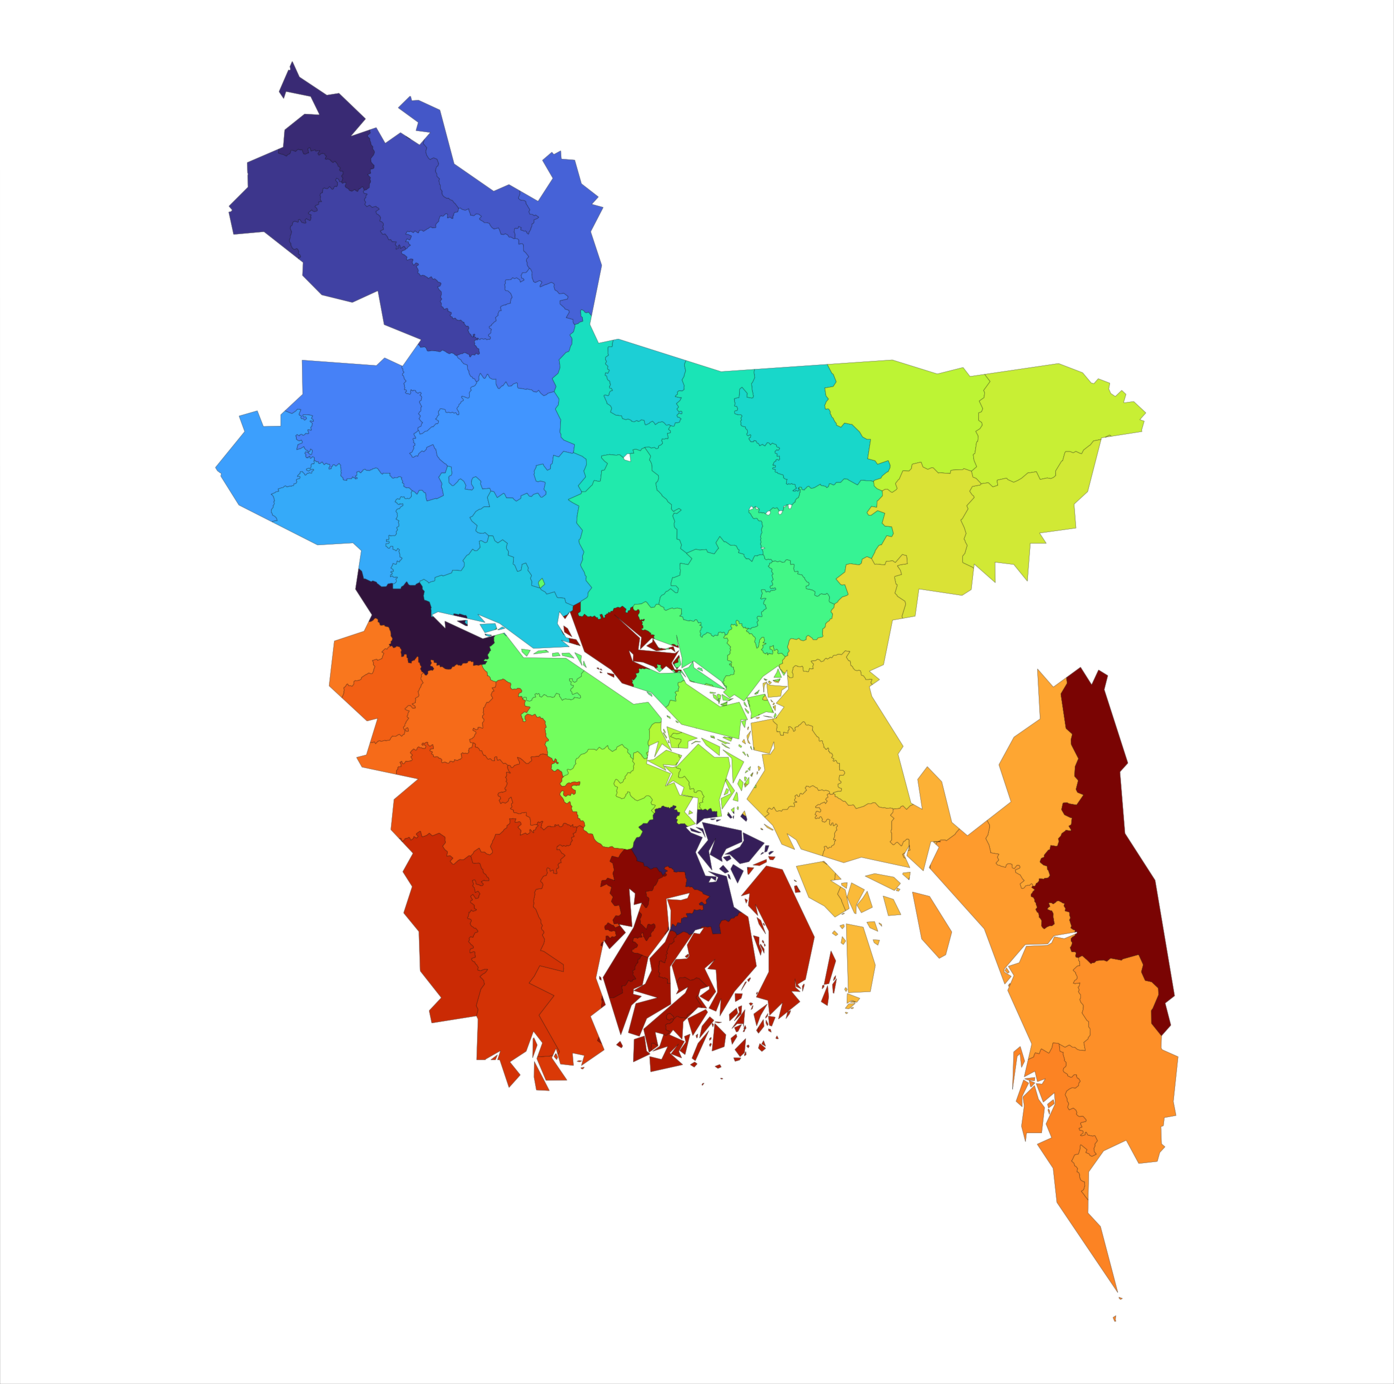 | 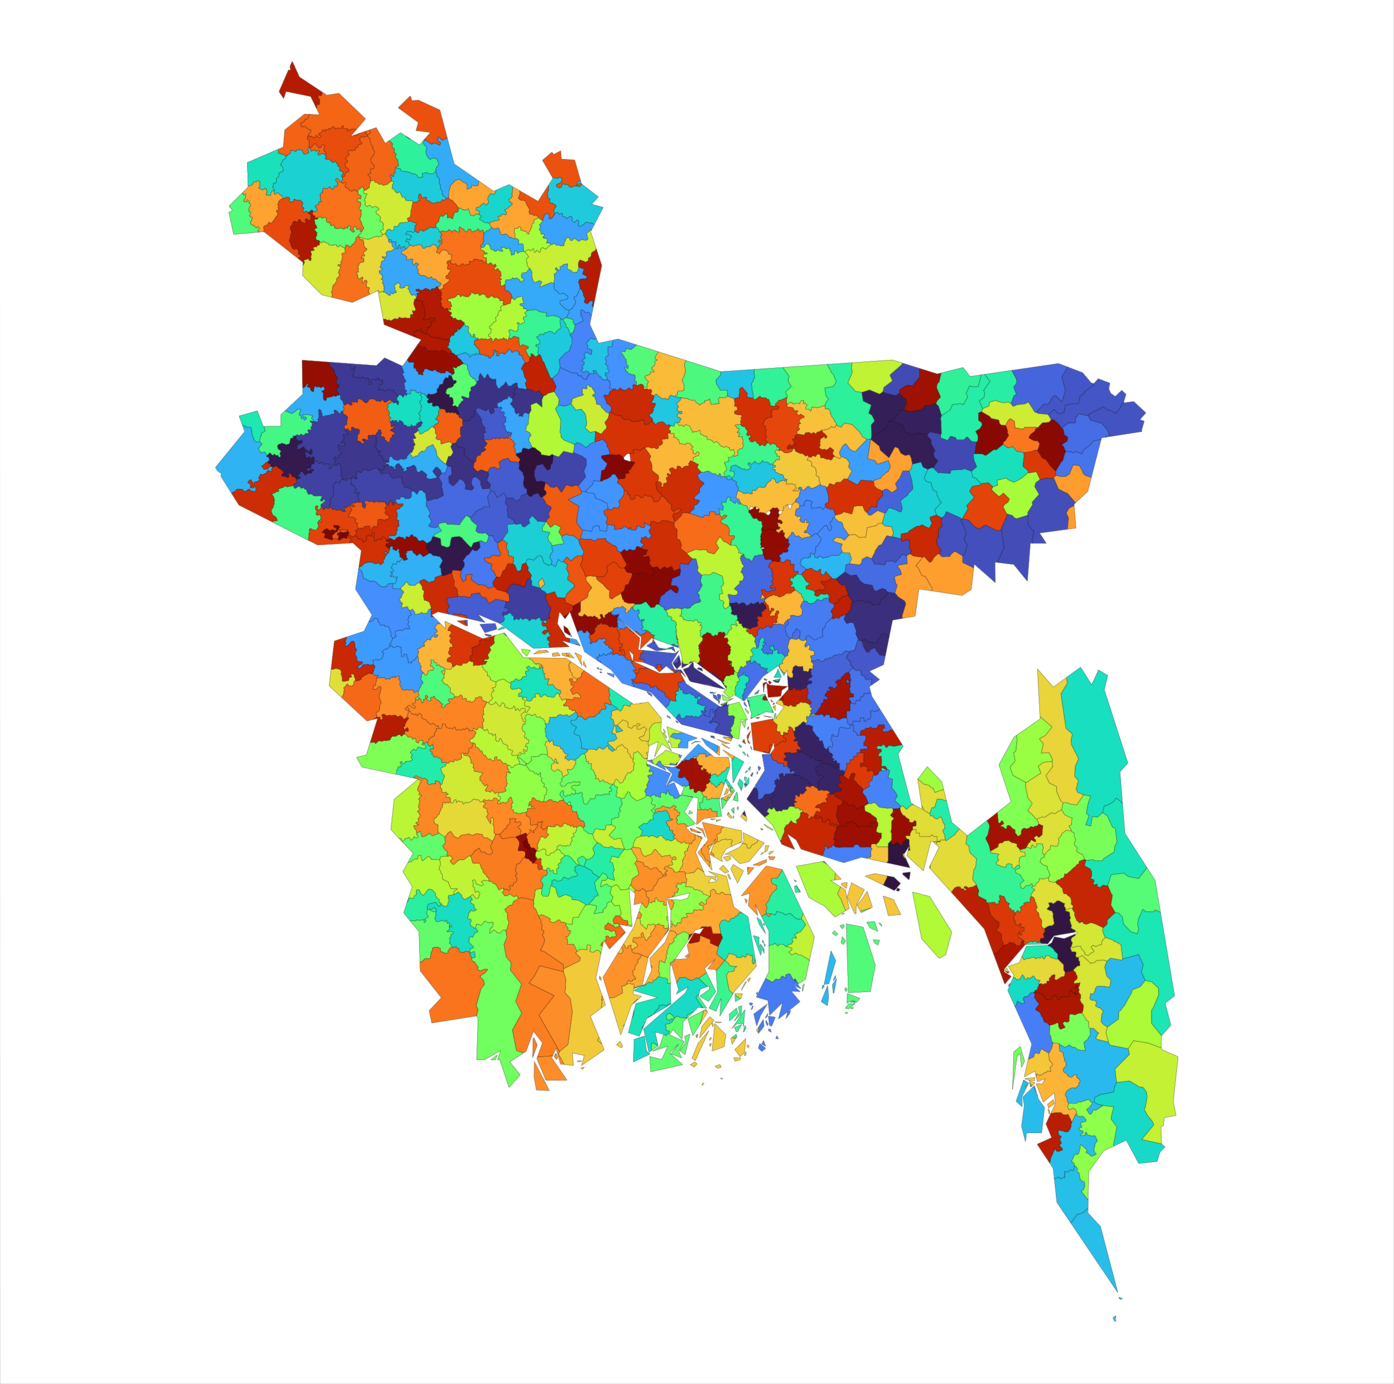 |
GeoNames’s data for Albania is less coherent as you descend down the administrative hierarchy.
| AL-1 | AL-2 | AL-3 |
|---|---|---|
 | 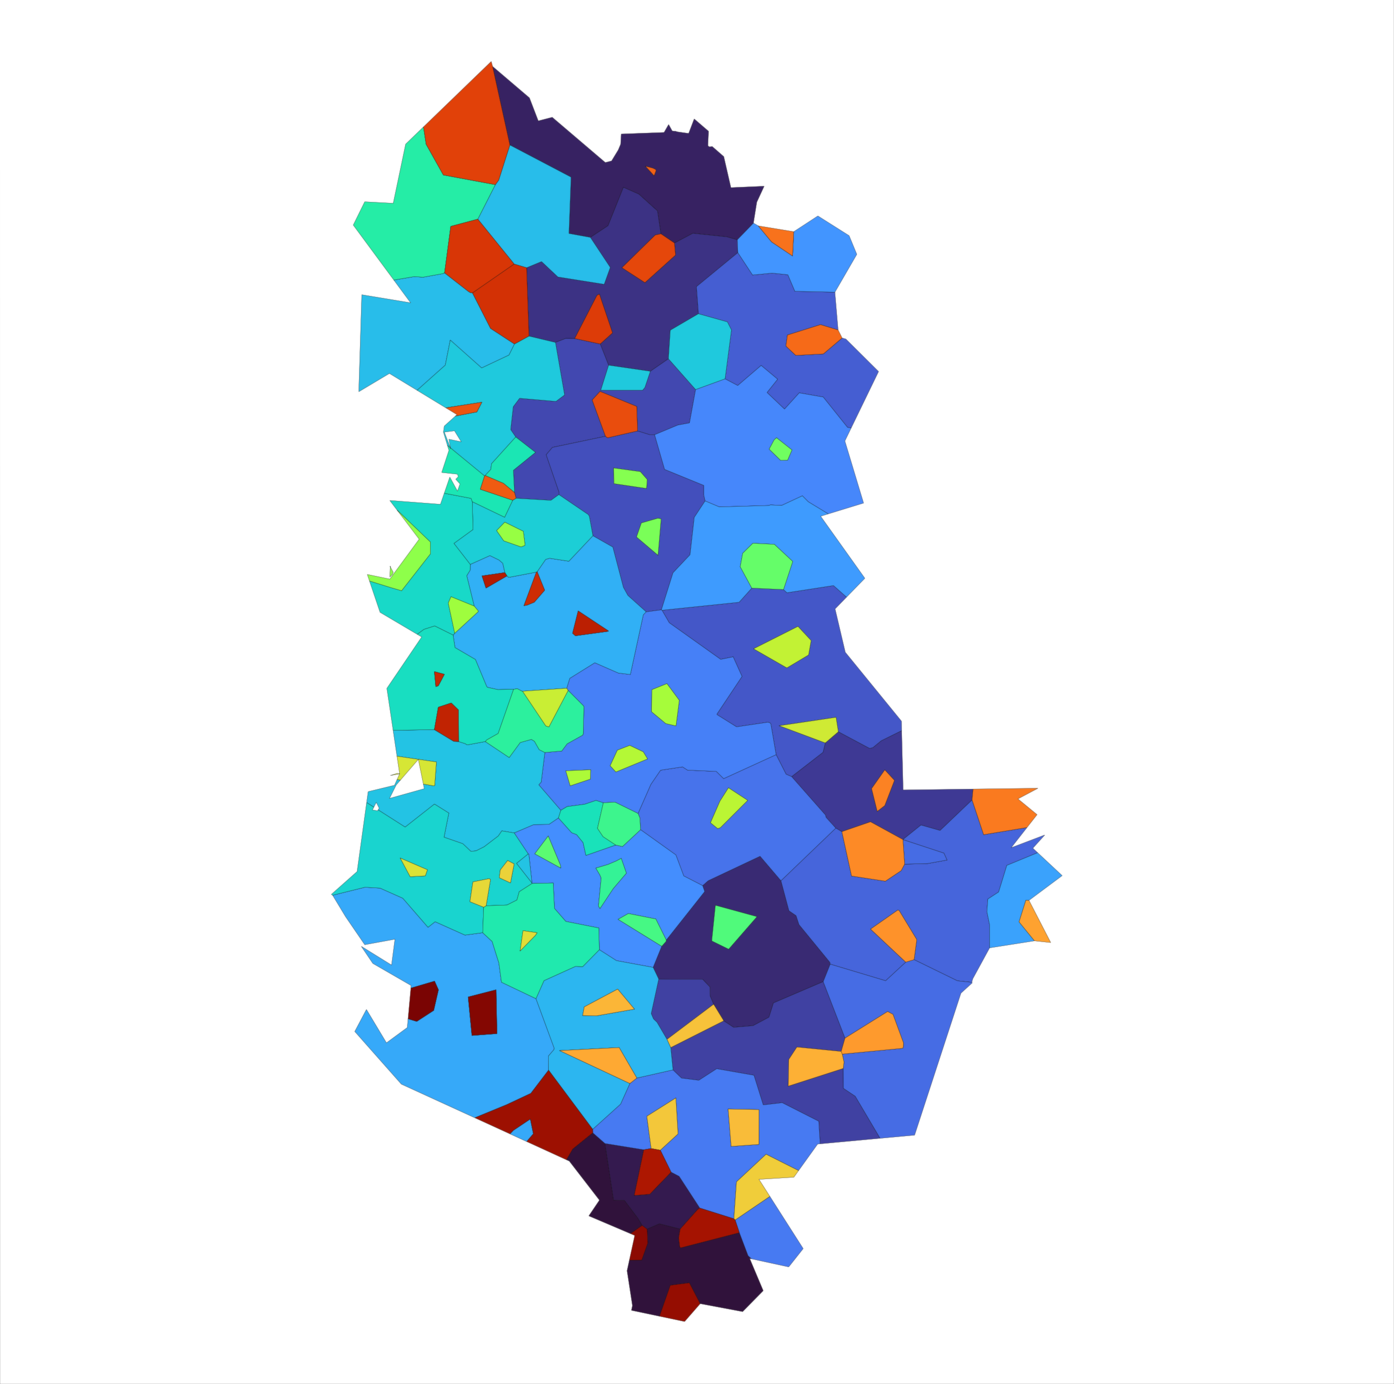 |  |
Sometimes output seems to vary in quality within a single administrative level of a country. Germany, Canada, and the United Kingdom all show inconsistent data quality at their second admin level.3
| DE-2 | CA-2 | GB-3 |
|---|---|---|
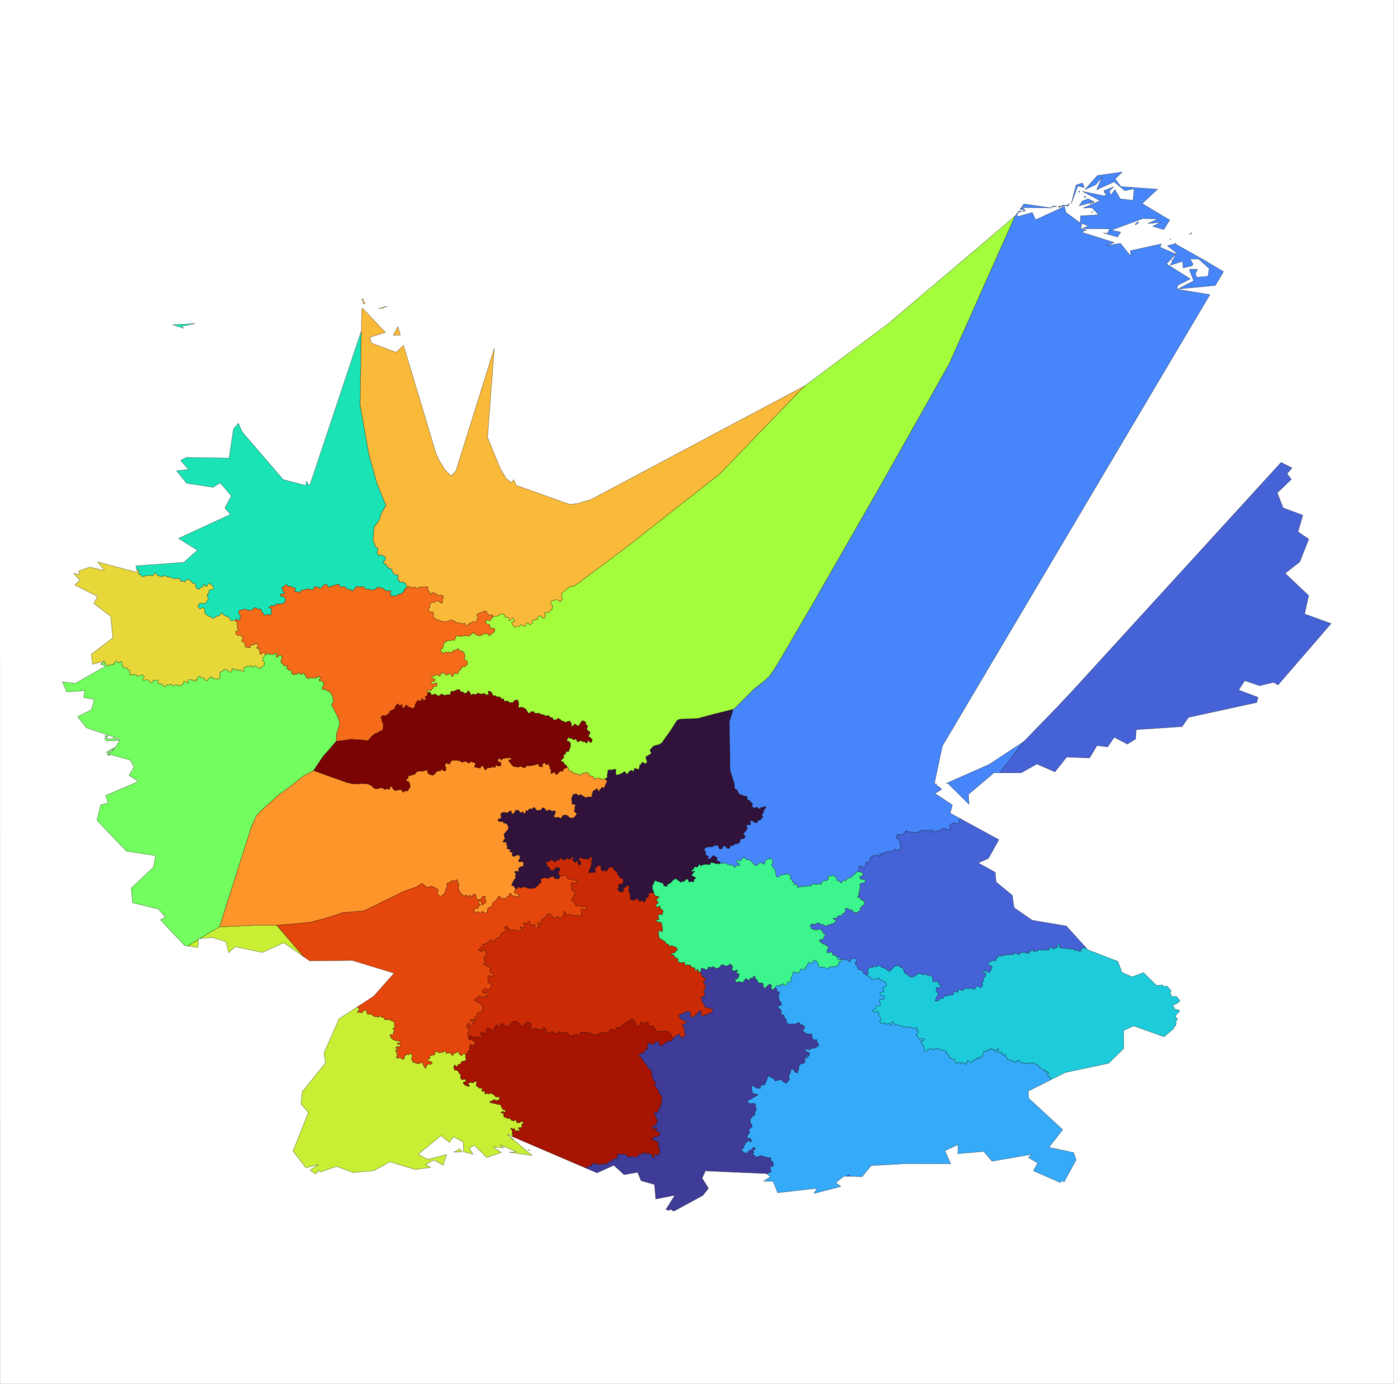 | 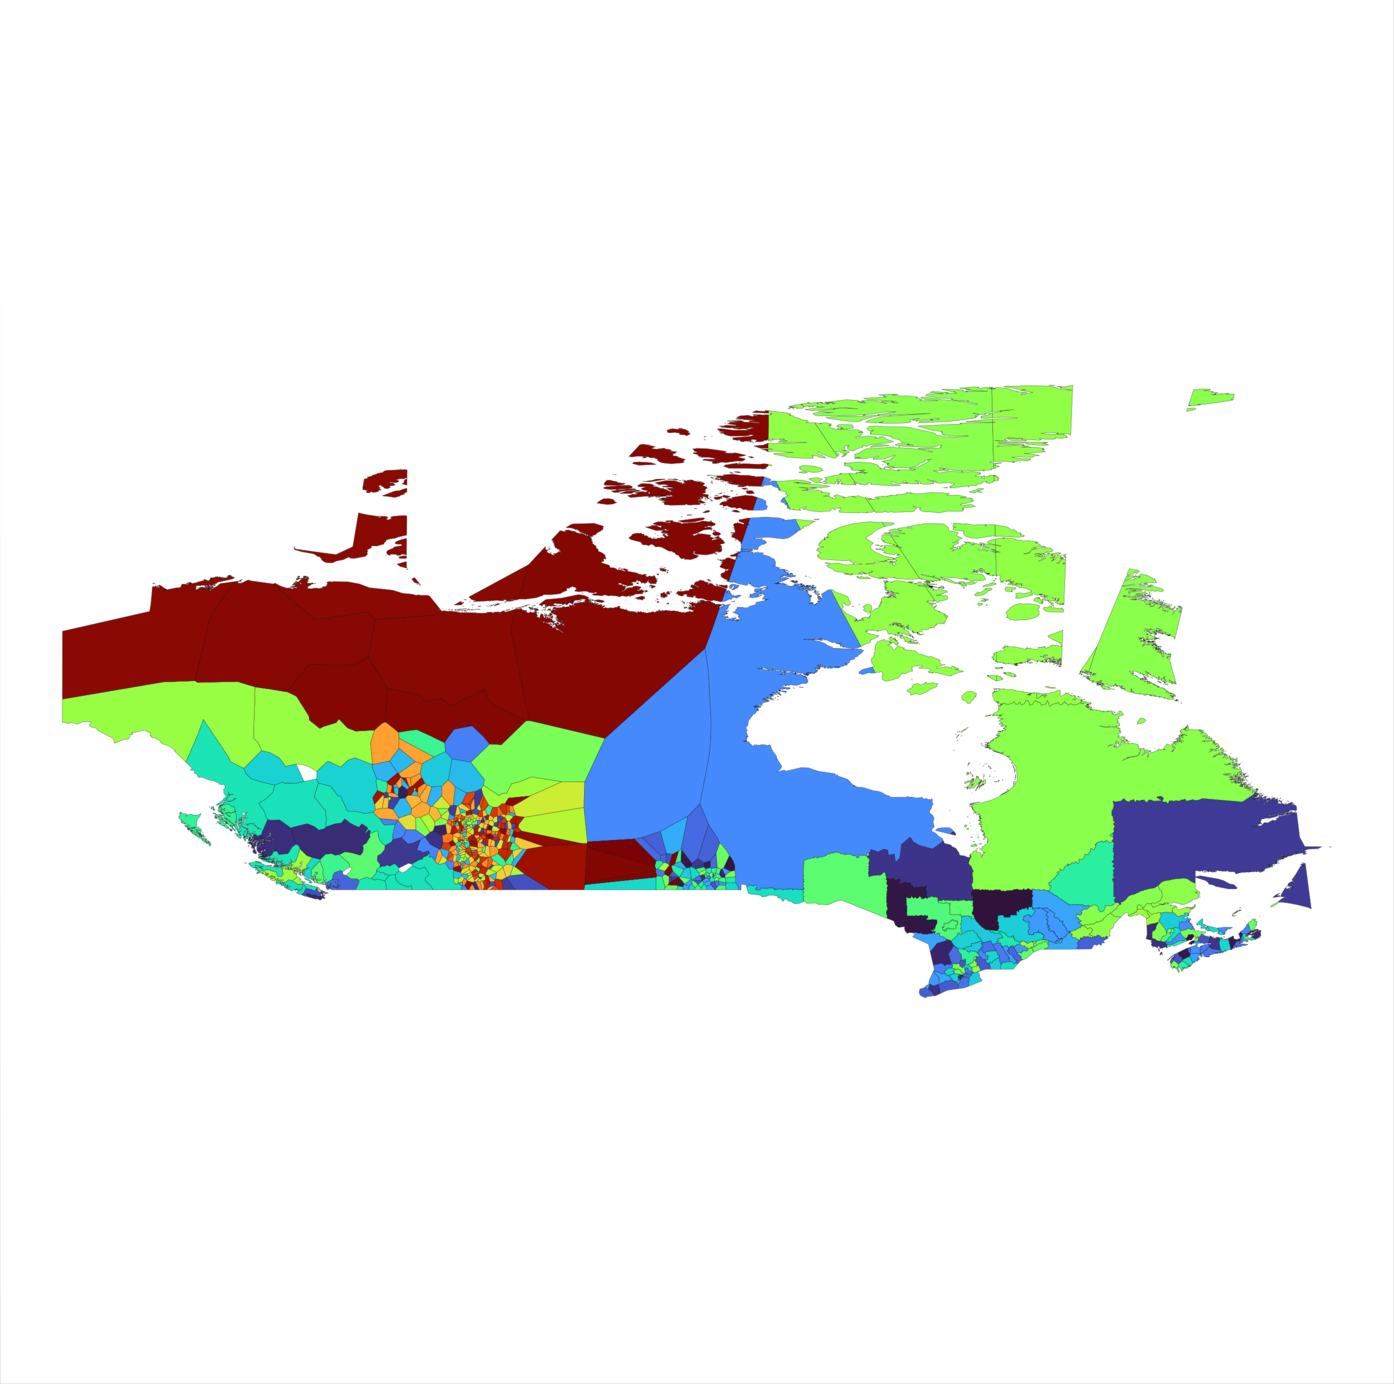 | 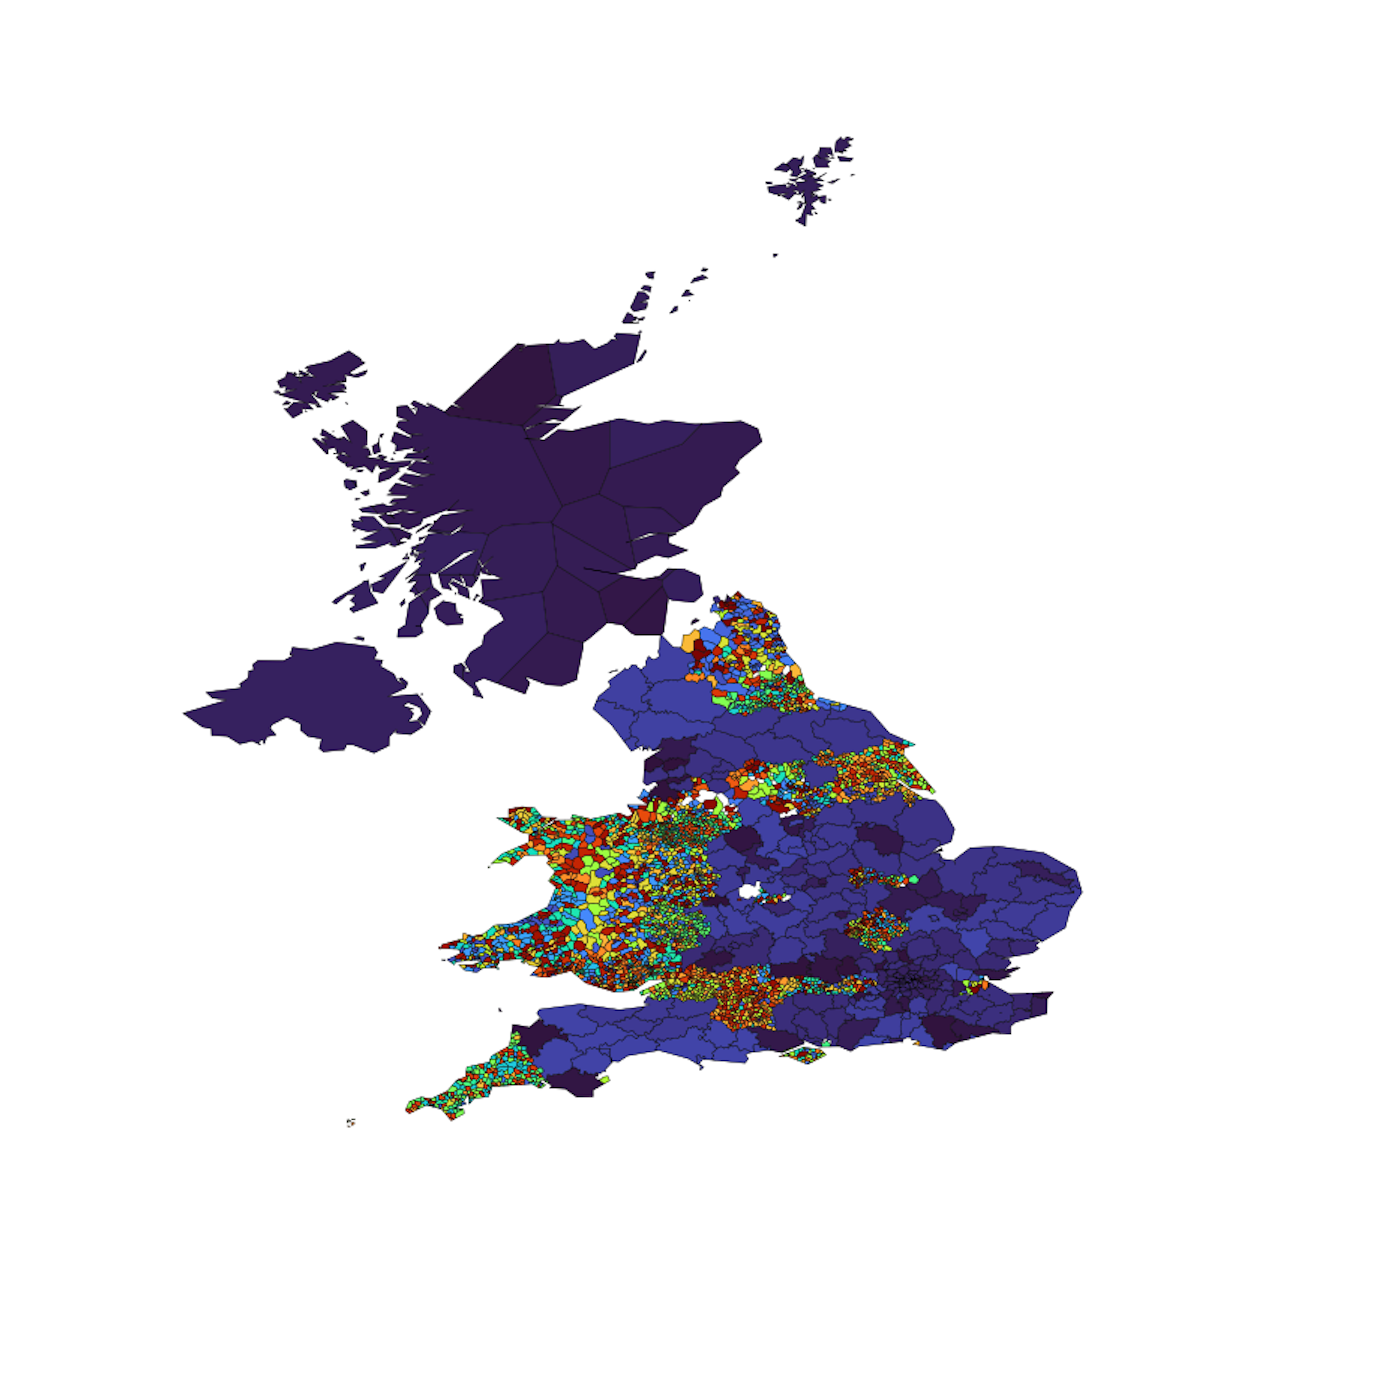 |
In general, higher administrative levels work better than lower ones, but countries vary wildly, so I’d recommend taking a look at the plots for areas you’re interested in, which you can download from the repo’s Releases. They provide a really interesting window into GeoNames’s data structure.
You can find more info about the files in the README.
To do
I worked on Voronoms during the first half of my batch at the Recurse Center. I’m posting this as a way of putting a period on version 1.0.0. However, there are a few other things I’d consider doing in the future.
- Compute descriptive statistics. I’d like to compute some information for each admin level and country, like the number of voronoi cells in each admin region, the average size, etc. This would make it easier to flag problematic areas without a visual inspection, and would just be interesting.
- Use hierarchical relationships to improve lower-level shapes, as discussed above.
- See if I can apply data cleaning to mislabeled cells that fall on the boundary between regions, which currently aren’t modified.
- There are holes in some country/admin combos (BG-2, ES-2); they should be fixed.
- It’d be good to have a way to programmatically access the GeoJSON without manually downloading the files or building them from scratch.
Admin areas: government-defined regions like states, counties, and cities. ↩︎
The jagged edges of the polygons are one of the ways in which Voronoms is less good than using official outlines. The nature of reconstructing outlines from a Voronoi diagram means that we’re gonna get jagged lines. One of the things I’d like to experiment with in a later version is using some kind of smoothing algorithm. ↩︎
In the UK, admin1 contains the countries that make up the UK, so the first level of administrative divisions is in admin2. ↩︎